
Push Score Calculator, measure your push notification performance instantly with our free Push Score Calculator. Analyze open rates, click-throughs, conversions, and frequency to optimize engagement.
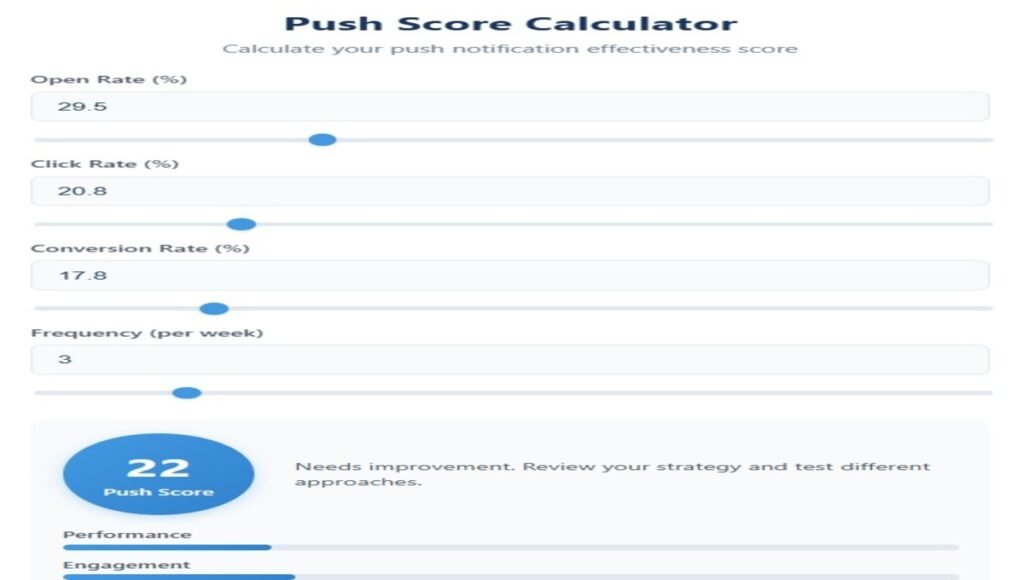
Push Score Calculator
Calculate your push notification effectiveness score
Push Score Calculator: Measure & Optimize Your Notification Performance
Table of Contents
- What is a Push Score Calculator?
- Why Push Notifications Need Performance Tracking
- How the Push Score Calculator Works
- Key Features of Our Push Score Calculator
- How to Use the Push Score Calculator
- Understanding Your Push Score Results
- Factors That Impact Push Notification Performance
- Trust & Security Guide
- Advances in Push Notification Analytics
- Frequently Asked Questions (FAQs)
1. What is a Push Score Calculator
Push Score Calculator is an analytical tool that evaluates the effectiveness of your push notification campaigns. It calculates a performance score based on key metrics like:
- Open Rate – Percentage of users who open your notifications
- Click-Through Rate (CTR) – Users who click on the notification
- Conversion Rate – Users who complete a desired action
- Frequency – How often you send notifications
This score helps marketers optimize engagement, reduce user fatigue, and improve ROI.
Why Does Push Score Matter
Identifies underperforming campaigns
Helps A/B test different messaging strategies
Prevents over-messaging (notification fatigue)
Increases user retention and conversions
2. Why Push Notifications Need Performance Tracking
Push notifications have an average open rate of 15-25%, but poorly optimized campaigns can see rates as low as 1-5%. Without tracking:
- You might annoy users with irrelevant messages
- Low CTR wastes marketing efforts
- High unsubscribe rates hurt long-term growth
Push Score Calculator provides data-driven insights to refine your strategy.
3. How the Push Score Calculator Works
Our calculator uses a weighted algorithm to generate a score (0-100):
Score Formula:Push Score=(0.4×Open Rate)+(0.3×CTR)+(0.2×Conversion Rate)+(0.1×Frequency Adjustment)Push Score=(0.4×Open Rate)+(0.3×CTR)+(0.2×Conversion Rate)+(0.1×Frequency Adjustment)
Example Calculation:
| Metric | Value | Weight | Contribution |
|---|---|---|---|
| Open Rate | 20% | 40% | 8 |
| CTR | 5% | 30% | 1.5 |
| Conversion Rate | 2% | 20% | 0.4 |
| Frequency | 3/week | 10% | 2.1 |
| Total Score | 72/100 | Good |
4. Key Features of Our Push Score Calculator
| Feature | Benefit |
|---|---|
| Real-Time Scoring | Instant feedback on campaign health |
| Interactive Sliders | Adjust metrics to simulate improvements |
| Performance Breakdown | See weak points (e.g., low CTR) |
| Frequency Optimization | Avoid sending too many/too few notifications |
| No Login Required | Use without sharing data |
| Mobile-Friendly | Works on all devices |
5. How to Use the Push Score Calculator
- Enter Open Rate (e.g., 15%)
- Input Click Rate (e.g., 4%)
- Add Conversion Rate (e.g., 1.5%)
- Set Frequency (e.g., 2 notifications/week)
- Get Your Score + Optimization Tips
6. Understanding Your Push Score Results
| Score Range | Rating | Action Needed |
|---|---|---|
| 80-100 | Excellent | Keep optimizing |
| 60-79 | Good | Improve CTR/conversions |
| 40-59 | Average | Test new messaging |
| 0-39 | Poor | Revise strategy |
How to Improve a Low Score:
- A/B test notification copy
- Personalize messages (e.g., use recipient’s name)
- Optimize send times (avoid late-night pushes)
- Segment audiences for relevance
7. Factors That Impact Push Notification Performance
| Factor | Ideal Range | Tip |
|---|---|---|
| Open Rate | 15-25% | Use compelling preview text |
| Click Rate | 3-8% | Include clear CTAs |
| Conversion Rate | 1-5% | Ensure landing page matches message |
| Frequency | 2-5/week | Avoid daily spam |
8. Trust & Security Guide
No Data Stored – Calculations happen in your browser.
Industry-Standard Metrics – Based on real marketing benchmarks.
Transparent Formula – No hidden scoring.
No Ads or Tracking – Clean, user-focused tool.
9. Advances in Push Notification Analytics
- AI-Powered Predictions (Future engagement forecasts)
- Sentiment Analysis (Detect positive/negative responses)
- Automated A/B Testing (AI suggests best-performing messages)
- Subscriber Fatigue Detection (Warns before unsubscribe risk)
Q1. What’s a good push notification score?
Scores above 70 are strong. Below 50 needs improvement.
Q2. How often should I send push notifications?
2-5 times/week is ideal for most industries.
Q3. Why is my open rate high but CTR low?
Your message may be engaging but lacks a clear CTA.
Q4. Do push notifications work for all industries?
Yes, but best for e-commerce, news, and apps.
Q5. Can I improve my score without more sends?
Yes! Try better timing, personalization, or urgency (e.g., “24-hour sale!”).
Final Thoughts
Push Score Calculator is essential for data-driven marketers. Use it to:
Maximize engagement
Reduce unsubscribe rates
Gain actionable insights
free calculator today and optimize your campaigns!